
- Published on
OpenTelemetry: A Guide to Observability with Go
- Name
- Luca Cavallin
Modern applications are often complex, distributed systems. Debugging them is not fun: you have to follow requests across services, logs get lost, and metrics are often hard to correlate. It's like looking for a needle in a haystack - except the haystack is on fire, and the needle keeps moving. This is where OpenTelemetry (OTel) can help.
OpenTelemetry is an open-source observability framework that helps collect and export traces, metrics, and logs from applications. It standardizes how telemetry data is gathered and makes it easy to integrate with tools like Grafana. With OpenTelemetry, we can finally get clear insights into our application's performance, allowing us to answer questions like "Why is this request slow?", "How many requests are active right now?", and "What errors are happening, and where?".
In this post, I'll walk through how to integrate OpenTelemetry in a Go application. By the end, you'll have a reusable telemetry package that sets up logging, metrics, and tracing - all without cluttering your application code! I've published the package, complete with tests and examples, on GitHub: gotel. Feel free to use it as a starting point for your own projects.
A Few Important Concepts First
Before we dive into code, let's break down the major components of OpenTelemetry: logs, metrics, and traces. These are the building blocks of observability, and they help us understand what's happening in our applications.
Providers, resources, exporters, and collectors are the components that work together to gather, process, and send telemetry data to an external system.
Logs, Metrics, and Traces
Logs, metrics, and traces are all types of telemetry data, but they serve different purposes. Here's a quick overview of each:
- Logs are records of discrete events. Think of them as diary entries for your application. When something goes wrong, logs are the first place you look.
- Metrics track numerical data over time, like request duration, CPU usage, or active connections. They help monitor trends and spot performance issues.
- Traces track a request as it flows through multiple services. A trace is made up of spans, each representing an individual operation.
Basically: logs tell us what happened, metrics show us how often it happens, and traces reveal how different parts of the system interact.
Providers, Resources, Exporters, and Collectors
In OpenTelemetry, providers, resources, exporters, and collectors work together to gather, process, and send telemetry data to an external system. Providers are responsible for generating telemetry data and they rely on resources, which define metadata about the application, such as the service name, version, and host. Once telemetry data is collected, it needs to be sent somewhere, which is what exporters do. Exporters forward data to an observability backend like Grafana. To manage this process more efficiently, OpenTelemetry uses collectors, which act as intermediaries, aggregating, processing, and routing telemetry data before sending it to one or multiple backends. Collectors help reduce application overhead and provide flexibility in telemetry storage and analysis.
Setting Up Telemetry in Go
Now, let's build a Go package that handles logs, metrics, and traces using OpenTelemetry. The package is called gotel and it's available on GitHub: gotel. This package wraps OpenTelemetry's SDK into a simple interface, making it easier to use.
Configuration
First, we need a way to configure our telemetry system. The config.go file handles this by loading settings from environment variables. This makes it easy to tweak the configuration without modifying the code.
package gotel

import (
	"fmt"

	"github.com/caarlos0/env"
)

// Config holds the configuration for the telemetry.
type Config struct {
	ServiceName    string `env:"SERVICE_NAME"      envDefault:"gotel"`
	ServiceVersion string `env:"SERVICE_VERSION"   envDefault:"0.0.1"`
	Enabled        bool   `env:"TELEMETRY_ENABLED" envDefault:"true"`
}

// NewConfigFromEnv creates a new telemetry config from the environment.
func NewConfigFromEnv() (Config, error) {
	telem := Config{}
	if err := env.Parse(&telem); err != nil {
		return Config{}, fmt.Errorf("failed to parse telemetry config: %w", err)
	}

	return telem, nil
}
This file defines a Config struct that stores the service name, version, and a flag to enable or disable telemetry. The NewConfigFromEnv function loads these values from environment variables, allowing us to tweak settings without modifying the code. If an environment variable is not set, a default value is used instead.
Providers & Exporters
Now that we have configuration in place, we need to set up providers-components responsible for handling logs, metrics, and traces.
The providers.go file contains functions to create logger, meter, and tracer providers. These functions are used to initialize the telemetry system in NewTelemetry. The newResource function is also defined in this file to attach metadata to all telemetry data, making it easier to track where the data is coming from.
package gotel

import (
	"context"
	"fmt"
	"os"

	"go.opentelemetry.io/otel"
	"go.opentelemetry.io/otel/exporters/otlp/otlplog/otlploggrpc"
	"go.opentelemetry.io/otel/exporters/otlp/otlpmetric/otlpmetricgrpc"
	"go.opentelemetry.io/otel/exporters/otlp/otlptrace/otlptracegrpc"
	"go.opentelemetry.io/otel/sdk/log"
	"go.opentelemetry.io/otel/sdk/metric"
	"go.opentelemetry.io/otel/sdk/resource"
	"go.opentelemetry.io/otel/sdk/trace"
	semconv "go.opentelemetry.io/otel/semconv/v1.17.0"
)

// newLoggerProvider creates a new logger provider with the OTLP gRPC exporter.
func newLoggerProvider(ctx context.Context, res *resource.Resource) (*log.LoggerProvider, error) {
	exporter, err := otlploggrpc.New(ctx)
	if err != nil {
		return nil, fmt.Errorf("failed to create OTLP log exporter: %w", err)
	}

	processor := log.NewBatchProcessor(exporter)
	lp := log.NewLoggerProvider(
		log.WithProcessor(processor),
		log.WithResource(res),
	)

	return lp, nil
}

// newMeterProvider creates a new meter provider with the OTLP gRPC exporter.
func newMeterProvider(ctx context.Context, res *resource.Resource) (*metric.MeterProvider, error) {
	exporter, err := otlpmetricgrpc.New(ctx)
	if err != nil {
		return nil, fmt.Errorf("failed to create OTLP metric exporter: %w", err)
	}

	mp := metric.NewMeterProvider(
		metric.WithReader(metric.NewPeriodicReader(exporter)),
		metric.WithResource(res),
	)
	otel.SetMeterProvider(mp)

	return mp, nil
}

// newTracerProvider creates a new tracer provider with the OTLP gRPC exporter.
func newTracerProvider(ctx context.Context, res *resource.Resource) (*trace.TracerProvider, error) {
	exporter, err := otlptracegrpc.New(ctx)
	if err != nil {
		return nil, fmt.Errorf("failed to create OTLP trace exporter: %w", err)
	}

	// Create Resource
	tp := trace.NewTracerProvider(
		trace.WithBatcher(exporter),
		trace.WithResource(res),
	)
	otel.SetTracerProvider(tp)

	return tp, nil
}

// newResource creates a new OTEL resource with the service name and version.
func newResource(serviceName string, serviceVersion string) *resource.Resource {
	hostName, _ := os.Hostname()

	return resource.NewWithAttributes(
		semconv.SchemaURL,
		semconv.ServiceName(serviceName),
		semconv.ServiceVersion(serviceVersion),
		semconv.HostName(hostName),
	)
}
We start by importing OpenTelemetry's SDK and exporters for logs, metrics, and traces. These exporters send data to an external system like Grafana or another OTLP-compatible backend.
The providers.go file contains functions for the following:
newLoggerProvider: creates a logger provider, which collects and exports logs. The OTLP gRPC exporter sends logs over the network via gRPC, and theBatchProcessorefficiently batches log entries before exporting them.newMeterProvider: creates a metrics provider, which is responsible for collecting metrics. It periodically exports metrics to a backend.newTracerProvider: creates a tracing provider to track request flows and exports them to an external backend.newResource: creates a resource with metadata about the application, such as the service name, version, and hostname. This information is attached to all telemetry data.
For all telemetry, I am using the OTLP gRPC exporter, which is the default and most commonly used exporter in OpenTelemetry. OTLP (OpenTelemetry Protocol) is a standardized format for transmitting logs, metrics, and traces between applications and observability backends. It supports both gRPC and HTTP transport, allowing data to be sent efficiently in high-throughput environments. I chose OTLP gRPC because it provides low-latency, high-performance communication with strong streaming support, making it ideal for production workloads. However, OpenTelemetry supports many other exporters, depending on your use case.
Bringing It All Together
The Telemetry struct wraps all the components together. This is handy when we want to pass the telemetry system to other parts of the application. For example, we can use the Telemetry struct in middleware to log requests and measure request duration. The telemetry.go file contains the Telemetry struct and the TelemetryProvider interface, which defines the methods that the Telemetry struct implements. The Telemetry struct is a wrapper around the OpenTelemetry logger, meter, and tracer.
package gotel

import (
	"context"
	"fmt"
	"os"

	"github.com/gin-gonic/gin"
	"go.opentelemetry.io/contrib/bridges/otelzap"
	otelmetric "go.opentelemetry.io/otel/metric"
	"go.opentelemetry.io/otel/sdk/log"
	"go.opentelemetry.io/otel/sdk/metric"
	"go.opentelemetry.io/otel/sdk/trace"
	oteltrace "go.opentelemetry.io/otel/trace"
	"go.uber.org/zap"
	"go.uber.org/zap/zapcore"
)

// TelemetryProvider is an interface for the telemetry provider.
type TelemetryProvider interface {
	GetServiceName() string
	LogInfo(args ...interface{})
	LogErrorln(args ...interface{})
	LogFatalln(args ...interface{})
	MeterInt64Histogram(metric Metric) (otelmetric.Int64Histogram, error)
	MeterInt64UpDownCounter(metric Metric) (otelmetric.Int64UpDownCounter, error)
	TraceStart(ctx context.Context, name string) (context.Context, oteltrace.Span)
	LogRequest() gin.HandlerFunc
	MeterRequestDuration() gin.HandlerFunc
	MeterRequestsInFlight() gin.HandlerFunc
	Shutdown(ctx context.Context)
}

// Telemetry is a wrapper around the OpenTelemetry logger, meter, and tracer.
type Telemetry struct {
	lp     *log.LoggerProvider
	mp     *metric.MeterProvider
	tp     *trace.TracerProvider
	log    *zap.SugaredLogger
	meter  otelmetric.Meter
	tracer oteltrace.Tracer
	cfg    Config
}

// NewTelemetry creates a new telemetry instance.
func NewTelemetry(ctx context.Context, cfg Config) (*Telemetry, error) {
	rp := newResource(cfg.ServiceName, cfg.ServiceVersion)

	lp, err := newLoggerProvider(ctx, rp)
	if err != nil {
		return nil, fmt.Errorf("failed to create logger: %w", err)
	}

	logger := zap.New(
		zapcore.NewTee(
			zapcore.NewCore(zapcore.NewJSONEncoder(zap.NewProductionEncoderConfig()), zapcore.AddSync(os.Stdout), zapcore.InfoLevel),
			otelzap.NewCore(cfg.ServiceName, otelzap.WithLoggerProvider(lp)),
		),
	)

	mp, err := newMeterProvider(ctx, rp)
	if err != nil {
		return nil, fmt.Errorf("failed to create meter: %w", err)
	}
	meter := mp.Meter(cfg.ServiceName)

	tp, err := newTracerProvider(ctx, rp)
	if err != nil {
		return nil, fmt.Errorf("failed to create tracer: %w", err)
	}
	tracer := tp.Tracer(cfg.ServiceName)

	return &Telemetry{
		lp:     lp,
		mp:     mp,
		tp:     tp,
		log:    logger.Sugar(),
		meter:  meter,
		tracer: tracer,
		cfg:    cfg,
	}, nil
}

// GetServiceName returns the name of the service.
func (t *Telemetry) GetServiceName() string {
	return t.cfg.ServiceName
}

// LogInfo logs a message at the info level.
func (t *Telemetry) LogInfo(args ...interface{}) {
	t.log.Info(args...)
}

// LogErrorln logs a message and then calls os.Exit(1).
func (t *Telemetry) LogErrorln(args ...interface{}) {
	t.log.Errorln(args...)
}

// LogFatalln logs a message and then calls os.Exit(1).
func (t *Telemetry) LogFatalln(args ...interface{}) {
	t.log.Fatalln(args...)
}

// MeterInt64Histogram creates a new int64 histogram metric.
func (t *Telemetry) MeterInt64Histogram(metric Metric) (otelmetric.Int64Histogram, error) { //nolint:ireturn
	histogram, err := t.meter.Int64Histogram(
		metric.Name,
		otelmetric.WithDescription(metric.Description),
		otelmetric.WithUnit(metric.Unit),
	)

	if err != nil {
		return nil, fmt.Errorf("failed to create histogram: %w", err)
	}

	return histogram, nil
}

// MeterInt64UpDownCounter creates a new int64 up down counter metric.
func (t *Telemetry) MeterInt64UpDownCounter(metric Metric) (otelmetric.Int64UpDownCounter, error) { //nolint:ireturn
	counter, err := t.meter.Int64UpDownCounter(
		metric.Name,
		otelmetric.WithDescription(metric.Description),
		otelmetric.WithUnit(metric.Unit),
	)

	if err != nil {
		return nil, fmt.Errorf("failed to create counter: %w", err)
	}

	return counter, nil
}

// TraceStart starts a new span with the given name. The span must be ended by calling End.
func (t *Telemetry) TraceStart(ctx context.Context, name string) (context.Context, oteltrace.Span) { //nolint:ireturn
	//nolint: spancheck
	return t.tracer.Start(ctx, name)
}

// Shutdown shuts down the logger, meter, and tracer.
func (t *Telemetry) Shutdown(ctx context.Context) {
	t.lp.Shutdown(ctx)
	t.mp.Shutdown(ctx)
	t.tp.Shutdown(ctx)
}
In this file, a TelemetryProvider interface is defined to make it easier to mock the telemetry package in tests, but also to make it easier to swap out the underlying telemetry system in the future.
The NewTelemetry function initializes logging, metrics, and tracing and returns an instance of the Telemetry struct. I am using the zap logger for simplicity, but you can use any other logger that integrates with OpenTelemetry. Keep in mind, the zap logger requires a so-called "bridge" (otelzap) to work with OpenTelemetry.
An advantage of defining the TelemetryProvider interface is that we can easily swap out the underlying telemetry system, for example in tests. Here's an example of a no-op telemetry provider that can be used in tests:
package gotel

import (
	"context"
	"os"

	"github.com/gin-gonic/gin"
	"go.opentelemetry.io/otel/metric"
	"go.opentelemetry.io/otel/trace"
)

// NoopTelemetry is a no-op implementation of the TelemetryProvider interface.
type NoopTelemetry struct {
	serviceName string
}

// NewNoopTelemetry creates a new NoopTelemetry instance.
func NewNoopTelemetry(cfg Config) (*NoopTelemetry, error) {
	return &NoopTelemetry{serviceName: cfg.ServiceName}, nil
}

// GetServiceName returns the service name.
func (t *NoopTelemetry) GetServiceName() string { return t.serviceName }

// LogInfo logs nothing.
func (t *NoopTelemetry) LogInfo(args ...interface{}) {}

// LogErrorln logs nothing.
func (t *NoopTelemetry) LogErrorln(args ...interface{}) {}

// LogFatalln logs nothing, then exits.
func (t *NoopTelemetry) LogFatalln(args ...interface{}) {
	os.Exit(1)
}

// LogRequest is a no-op middleware.
func (t *NoopTelemetry) LogRequest() gin.HandlerFunc {
	return func(c *gin.Context) { c.Next() }
}

// MeterRequestDuration is a no-op middleware.
func (t *NoopTelemetry) MeterRequestDuration() gin.HandlerFunc {
	return func(c *gin.Context) { c.Next() }
}

// MeterRequestsInFlight is a no-op middleware.
func (t *NoopTelemetry) MeterRequestsInFlight() gin.HandlerFunc {
	return func(c *gin.Context) { c.Next() }
}

// TraceStart returns the context and span unchanged.
func (t *NoopTelemetry) TraceStart(ctx context.Context, name string) (context.Context, trace.Span) {
	return ctx, trace.SpanFromContext(ctx)
}

// MeterInt64Histogram returns nil.
func (t *NoopTelemetry) MeterInt64Histogram(metric Metric) (metric.Int64Histogram, error) {
	return nil, nil
}

// MeterInt64UpDownCounter returns nil.
func (t *NoopTelemetry) MeterInt64UpDownCounter(metric Metric) (metric.Int64UpDownCounter, error) {
	return nil, nil
}

// Shutdown does nothing.
func (t *NoopTelemetry) Shutdown(ctx context.Context) {}
The NoopTelemetry struct implements the TelemetryProvider interface, but does nothing. This is useful for tests, where we don't want to send telemetry data to an external system.
Using the Telemetry Package
In main.go, we can now initialize and use our telemetry system. Here's an example of how to use the gotel package to create a new telemetry system. In this example, if the initialization fails, the NewTelemetry function falls back to a no-op telemetry system. This is useful for graceful degradation, where we want to continue running the application even if the telemetry system is down.
package main

import (
	"context"
	"fmt"
	"os"

	"github.com/lucavallin/gotel"
)

func main() {
	ctx := context.Background()

	telemConfig, err := gotel.NewConfigFromEnv()
	if err != nil {
		fmt.Println("failed to load telemetry config")
		os.Exit(1)
	}

	// Initialize telemetry. If the exporter fails, fallback to nop.
	var telem gotel.TelemetryProvider
	telem, err = gotel.NewTelemetry(ctx, telemConfig)
	if err != nil {
		fmt.Println("failed to create telemetry, falling back to no-op telemetry")
		telem, _ = gotel.NewNoopTelemetry(telemConfig)
	}
	defer telem.Shutdown(ctx)

	telem.LogInfo("telemetry initialized")
}
The telem variable is an instance of the Telemetry struct, which implements the TelemetryProvider interface. It can be used to write info-level logs with telem.LogInfo(), for example. The telem variable can also be passed to other parts of the application, like services, middleware, etc.
What About Traces?
Traces track a request as it flows through multiple services. A trace is made up of spans, each representing an individual operation. The TraceStart function that the gotel package provides is a convenient way to start a new span and attach it to the current context. This is useful for instrumenting HTTP requests, for example.
Let's take this example of a fictional API:
type API struct {
	telem   gotel.TelemetryProvider
	httpSrv *http.Server
}
This API has a telem field that holds a reference to the telemetry system. I like to structure my APIs this way because it makes it easy to use dependencies in the HTTP handlers.
func (a *API) GetSomething(c *gin.Context) {
	_, span := a.telem.TraceStart(c.Request.Context(), "get_something")
	defer span.End()

	something := []string{"foo", "bar", "baz"}

	c.JSON(http.StatusOK, something)
}
In this example, the GetSomething handler starts a new span with the name get_something and attaches it to the current context. The defer span.End() statement ends the span when the function returns.
Middlewares & Metrics
A common pattern is to use middlewares to instrument HTTP requests. Here's an example of a telemetry middleware that logs request duration and counts requests in flight. This is useful for monitoring the health of the application.
In a metrics.go file, we define a Metrics struct that holds references to the metrics we want to collect. This makes it easy to pass the metrics to middleware and other parts of the application. The Metric struct defines the name, unit, and description of a metric. This is useful for defining metrics in a reusable way.
package gotel

// Metric represents a metric that can be collected by the server.
type Metric struct {
	Name        string
	Unit        string
	Description string
}

// MetricRequestDurationMillis is a metric that measures the latency of HTTP requests processed by the server, in milliseconds.
var MetricRequestDurationMillis = Metric{
	Name:        "request_duration_millis",
	Unit:        "ms",
	Description: "Measures the latency of HTTP requests processed by the server, in milliseconds.",
}

// MetricRequestsInFlight is a metric that measures the number of requests currently being processed by the server.
var MetricRequestsInFlight = Metric{
	Name:        "requests_inflight",
	Unit:        "{count}",
	Description: "Measures the number of requests currently being processed by the server.",
}
A middleware.go file instead contains the telemetry middleware, for use with the gin web framework. The middleware functions defined can be used to log requests, measure request duration, and count requests in flight.
package gotel

import (
	"fmt"
	"time"

	"github.com/gin-gonic/gin"

	"go.opentelemetry.io/otel/metric"
	"go.opentelemetry.io/otel/semconv/v1.20.0/httpconv"
)

// LogRequest is a gin middleware that logs the request path.
func (t *Telemetry) LogRequest() gin.HandlerFunc {
	return func(c *gin.Context) {
		t.LogInfo("request to ", c.Request.URL.Path)
		c.Next()
		t.LogInfo("end of request to ", c.Request.URL.Path)
	}
}

// MeterRequestDuration is a gin middleware that captures the duration of the request.
func (t *Telemetry) MeterRequestDuration() gin.HandlerFunc {
	// init metric, here we are using histogram for capturing request duration
	histogram, err := t.MeterInt64Histogram(MetricRequestDurationMillis)
	if err != nil {
		t.LogFatalln(fmt.Errorf("failed to create histogram: %w", err))
	}

	return func(c *gin.Context) {
		// capture the start time of the request
		startTime := time.Now()

		// execute next http handler
		c.Next()

		// record the request duration
		duration := time.Since(startTime)
		histogram.Record(
			c.Request.Context(),
			duration.Milliseconds(),
			metric.WithAttributes(
				httpconv.ServerRequest(t.GetServiceName(), c.Request)...,
			),
		)
	}
}

// MeterRequestsInFlight is a gin middleware that captures the number of requests in flight.
func (t *Telemetry) MeterRequestsInFlight() gin.HandlerFunc {
	// init metric, here we are using counter for capturing request in flight
	counter, err := t.MeterInt64UpDownCounter(MetricRequestsInFlight)
	if err != nil {
		t.LogFatalln(fmt.Errorf("failed to create counter: %w", err))
	}

	return func(c *gin.Context) {
		// define metric attributes
		attrs := metric.WithAttributes(httpconv.ServerRequest(t.GetServiceName(), c.Request)...)

		// increase the number of requests in flight
		counter.Add(c.Request.Context(), 1, attrs)

		// execute next http handler
		c.Next()

		// decrease the number of requests in flight
		counter.Add(c.Request.Context(), -1, attrs)
	}
}
You can then use the middleware in your application to get observability data transparently. For example, with gin-gonic/gin:
r := gin.New()
r.Use(telem.LogRequest())
r.Use(telem.MeterRequestDuration())
r.Use(telem.MeterRequestsInFlight())
See gin's Custom Middleware docs for more information.
So Where Does the Telemetry Go?
The telemetry data is sent to an observability backend, and Grafana's grafana/docker-otel-lgtm is an all-in-one OpenTelemetry backend that makes it easy to get started.
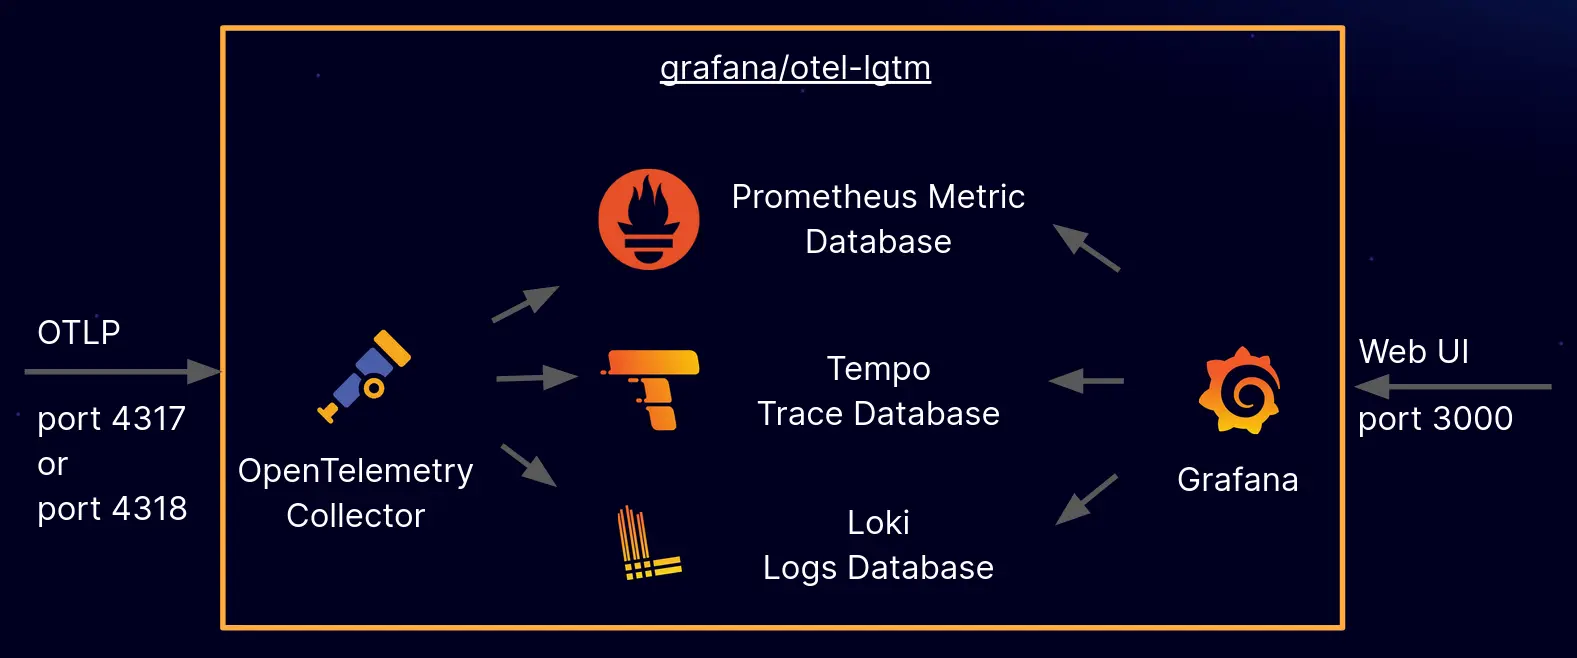
Grafana's grafana/docker-otel-lgtm is a Docker image that offers a ready-to-use OpenTelemetry backend. It integrates the OpenTelemetry Collector with Grafana's LGTM stack (Loki for logs, Grafana for visualization, Tempo for traces, and Mimir for metrics).
By running this container, you can receive OpenTelemetry signals on default ports (4317 for gRPC and 4318 for HTTP). These signals are then automatically forwarded: logs go to Loki, traces go to Tempo, and metrics go to Mimir.
Grafana is pre-configured to visualize all these data sources and is accessible via port 3000. This makes it a great solution for development, demos, and testing environments, providing a quick way to analyze telemetry data without needing extensive configuration.
Summary
Observability isn't just a nice-to-have, it's what keeps you from flying blind when things go wrong in your application. OpenTelemetry makes it easy to collect, process, and export logs, metrics, and traces in a way that's standardized and vendor-neutral. In this post, we broke down the key concepts of observability, explored how OpenTelemetry works, and built a reusable telemetry package in Go to keep logging, metrics, and tracing clean and consistent across an application.
By structuring everything into a single, easy-to-use package, we've made it simple to instrument your code without cluttering it. Whether you need to debug a slow request, track system performance, or figure out why your service is on fire at 2 AM, OpenTelemetry has you covered. And with Grafana's docker-otel-lgtm, you can spin up a fully functional OpenTelemetry backend in seconds to visualize all your telemetry data.
If you want to give it a try, check out gotel on GitHub. It's built to be plug-and-play, so you can start collecting logs, metrics, and traces right away. Happy coding, and may your traces always connect, your metrics make sense, and your logs tell you what actually happened! 🚀